Kids are finishing up school, which entails end-of-year parties, standardized testing, and projects. Businesses are pushing to boost sales as the end of the second quarter quickly approaches. Summer vacations are booked. You may feel a little bit overwhelmed!
Information & KPI Overload
It’s easy to get caught up in thinking that monitoring as many indicators as humanly possible is the best way to boost your performance. Multitasking, exhausting yourself, and spreading yourself too thin are not helpful when analyzing your performance.
The same goes with business… We often see that our clients have 8-10 KPIs (key performance indicators) per department to measure productivity. Assuming the average company has 6-10 departments, that means you’re tracking up to 100 KPIs!
How can 100 KEY Performance Indicators be useful?
Performance Indicators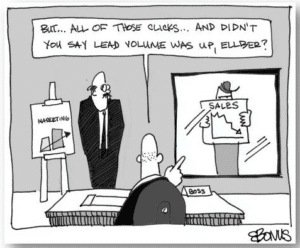
As a financial leader, it’s important to categorize which indicators are key and which are just to measure specific performance.
For example, a person who doesn’t differentiate KPIs and PIs might pitch that the company is doing well because it’s decreased the amount of time packing the inventory for shipping to customers by 15%. How does that correlate to sales and your net profit?
Too Many KPIs
Having too many KPIs can result in what I call KPI overload. So many organizations think that by having 8-10 KPIs per department, they will be better able to assess the performance of the company. WRONG.
(K.I.S.S. Keep it simple, stupid!)
Truth is: when you have 100 KPIs, no one has the time or energy to look at every one of them. All of the sudden, those KPIs become redundant to the company. There’s a lot of reading in between the lines to understand what the KPIs are measuring. Not to mention the wasted time preparing the measures that are most likely being ignored…
Difference Between KPI & PI
By performing an analysis of the most important business activities that drive profits and cash flow, you can then develop a set of true key performance indicators. Look for the 6-8 numbers that really drive the bottom line.
[box](NOTE: Why are KPIs important? Check out our KPI Discovery Cheatsheet!)[/box]
If you need more numbers than the 6-8 KPIs to analyze productivity, they aren’t necessarily KPIs. These PIs can be used for quality control, etc. A department might need to use a PI to manage their procedures; the key difference is that it doesn’t “move the needle”.
What is Key?
First, figure out what your CEO wants to know. As a financial leader, it’s imperative for you to act as a wingman to the CEO. You may have 100 indicators that you could give to your CEO… BUT do they have the time and knowledge to assess the general performance?
Give them the 40,000 foot view of the companies performance by providing 6-10 KPIs for your organization, regardless of the size of the company. Without this 40,000 foot view, it becomes difficult to discern what is key.
(How do you use flash reports to improve productivity? Check it out here now!)
Once you have identified some KPIs, it’s time to track them. Track KPIs and analyze variances. Then you may use trend tools, what-if scenarios, and breakeven analyses. Evaluate what is important.
For example, as you build a dynamic cash flow projection (one of the many trend tools you can create after identifying your KPIs), you’ll be able to key in assumptions that drive revenue and manage the cost of goods sold. By adjusting those numbers, you’ll be able to see what is sensitive.
[box]Strategic CFO Lab Member Extra
Access your Strategic Pricing Model Execution Plan in SCFO Lab. The step-by-step plan to set your prices to maximize profits.
Click here to access your Execution Plan. Not a Lab Member?
Click here to learn more about SCFO Labs[/box]


