R-Series Report » Overview
Click to download: The Strategic CFO R-Series Report
The Purpose Of The R-Series Report
The R-Series Report is a detailed ratio analysis package that can be used to analyze and benchmark the client’s financial health. These ratios can serve as the basis for monitoring the client’s performance and used in conjunction with the Flash Report.
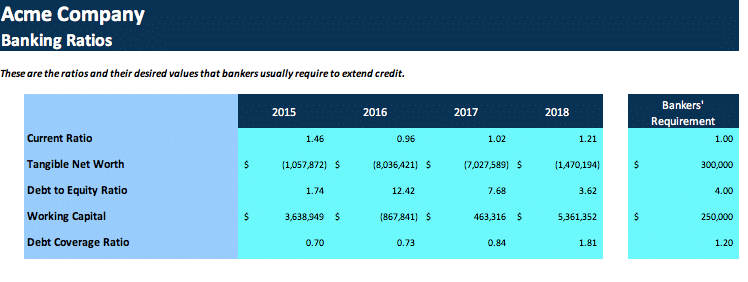
Concurrently, they may also serve as a useful financial tool for interfacing with banks and other financial institutions. Incidentally, many banks will ultimately ask that ratio analysis be done in order to gauge the financial health of the client firm especially when compared to other companies in the same sector.
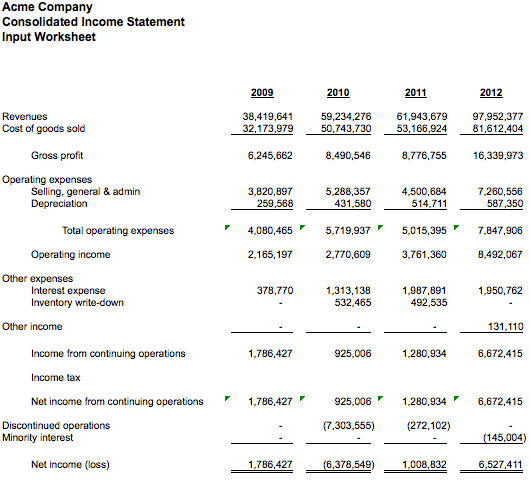
The R-Series Report consists of 3 INPUT Sections and 8 OUTPUT Sections:
INPUT Sections
- B/S Input
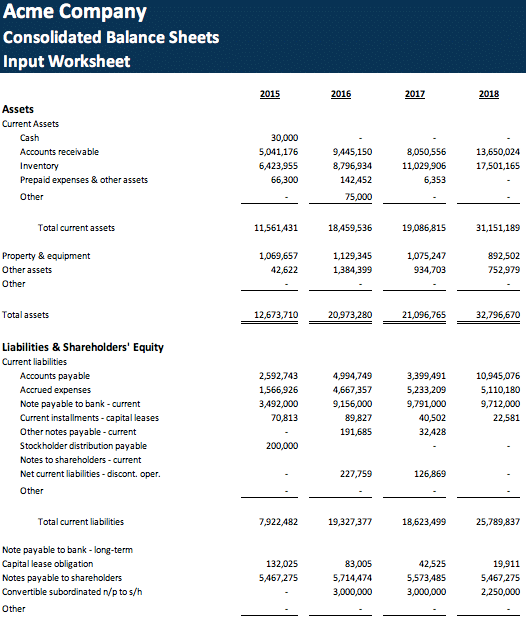
- P&L Input
- Select 4-Year Monthly Historical B/S Information

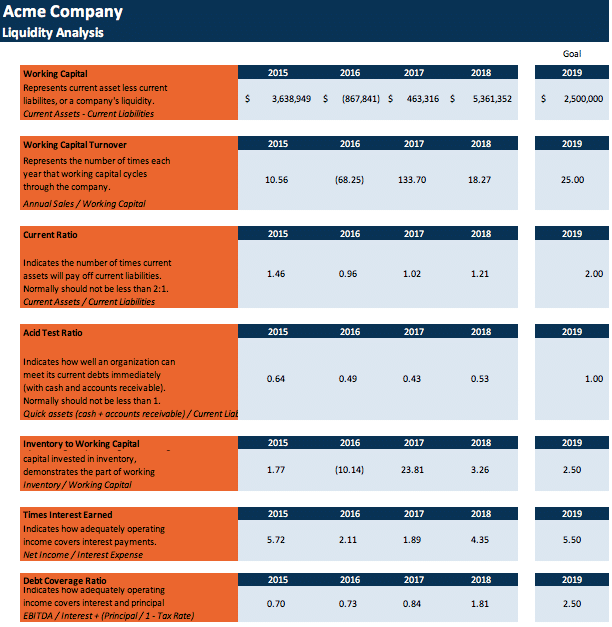
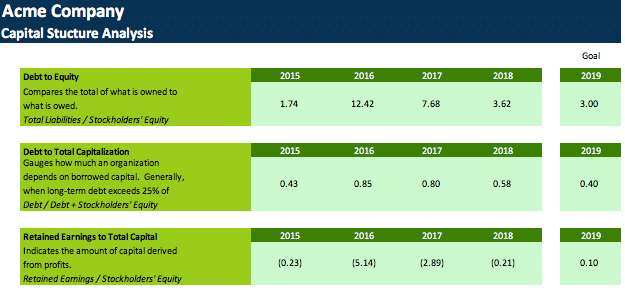
OUTPUT Sections
- (i.e. A/R, Inventory, A/P, Accrued Pay, Debt Repayment)
- Liquidity Ratios
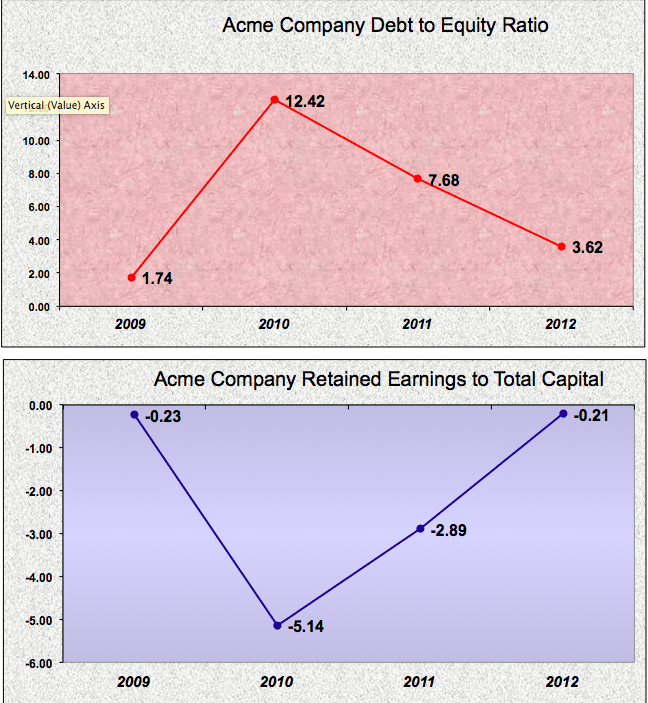
- Capital Structure Ratios
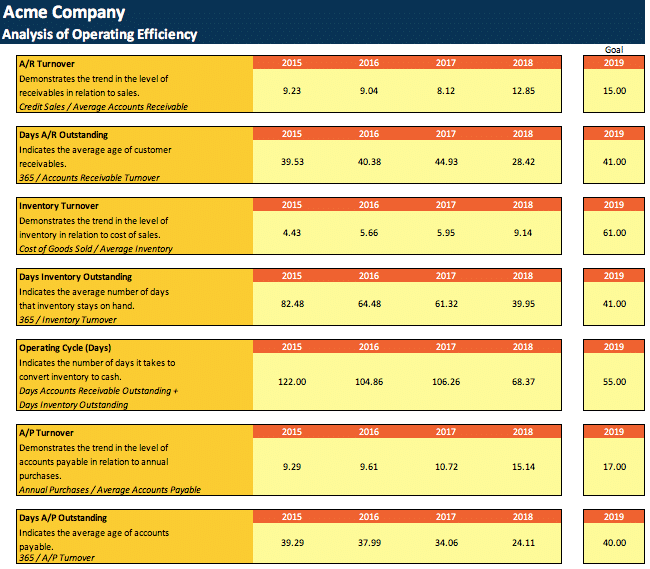
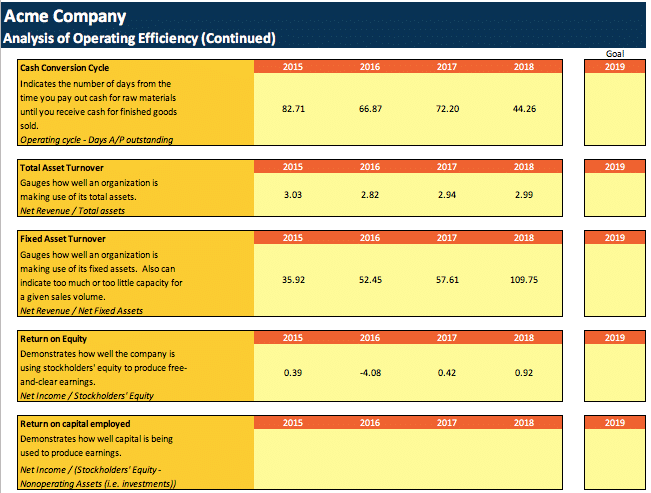
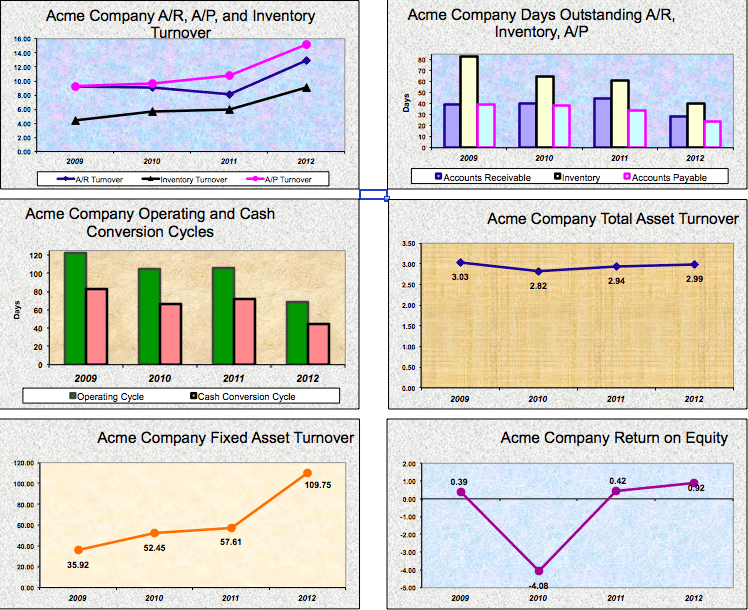
- Efficiency Ratios
- Bank Ratios
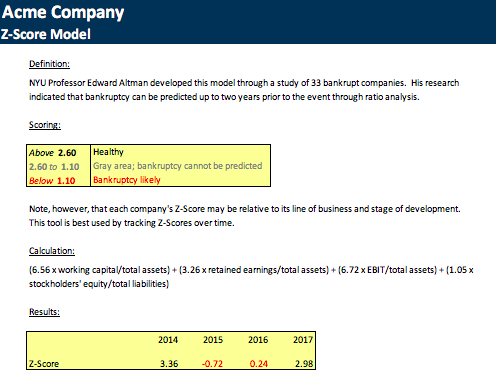
- Z-Score
- Liquidity Ratio Graphs
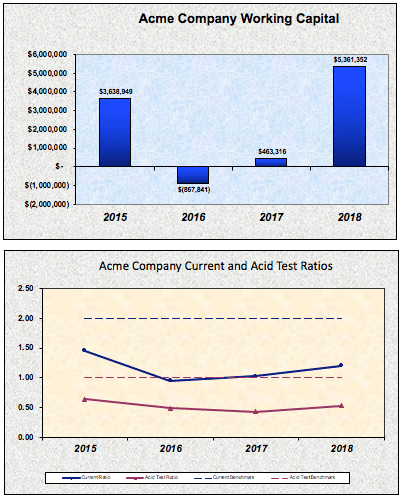
- Capital Structure Graphs
- Efficiency Ratio Graphs
How Often To Produce The R-Series Report
The inputs required to complete the R-Series Report require less effort and time to track down than many of the other tools. However, it is important that historical accounting information is accurate and available. Thereafter, it will just be necessary to maintain the graphs by inputting the information in on a monthly or quarterly basis.
How To Produce The R-Series Report
The R-Series Report is produced using your current and historical financial statements. Ideally, you will have 4 years’ worth of historical financial statements, but if you don’t, that’s just fine.
As you become more familiar with your company’s processes and begin to finish some more higher priority tasks, then your attention will begin to turn to other projects that add value. The R-Series Report can also fulfill that role by providing a metric to track performance and financial health of your company over several years. This report can also serve as a useful tie-in to your Flash Report. For instance, one of the key productivity metrics used in the Flash report may include some of the financial ratios such as Cash Conversion Cycle and/or Operating Cycle.
R-Series Report Template
Click to download: The Strategic CFO R-Series Report