12 on 12 Analysis » Overview
The Purpose of 12 On 12 Analysis
The 12 on 12 Analysis—also known as the Trailing Twelve-Month (TTM) Chart—serves two essential purposes:
- To identify trends in your Key Performance Indicators (KPIs).
- To uncover potential cause-and-effect relationships between two or more variables (e.g., sales and customer count).
Originally introduced by Kraig Kramer of CEO Tools, this method is both an economic and predictive analysis tool. It allows businesses to anticipate shifts—upturns or downturns—in performance or industry dynamics. This proactive approach helps leaders better prepare for challenges or seize growth opportunities.
How to Conduct a 12 on 12 Analysis
Let’s break down the process:
Step 1: Determine the Variable
Start by identifying the key metric you want to measure—such as monthly revenue, number of customers, or website traffic. This becomes your primary variable for analysis.
Step 2: Accumulate Historical Data
To identify meaningful trends, collect at least 24 months of historical data—though the more, the better. For some clients, analyses have been run with up to 30 years of data.
Take the total for each 12-month trailing period and compare it with the prior year’s equivalent. This approach smooths out seasonality and offers a more accurate view than comparing individual months (e.g., comparing December to May is often misleading due to seasonal differences).
Example: Instead of comparing March 2024 to March 2023, you’d sum up April 2023–March 2024 and compare it to April 2022–March 2023.
Step 3: Identify and Test Correlated Variables
Once you’ve tracked your key metric, identify 2–3 related variables that may influence or correlate with it. These could be internal metrics (like customer retention rate) or external ones (like economic indices or market demand).
Run tests to find variables with strong correlation to your primary KPI—these relationships can help with root cause analysis, forecasting, and decision-making.
Why It Matters
By applying a 12 on 12 Analysis, you:
- Eliminate seasonal distortions in reporting
- Uncover patterns hidden in short-term data
- Predict and prepare for future outcomes
- Gain insights for smarter strategy and operations
This tool is especially useful for CFOs, business analysts, and executives aiming to align data with decision-making.
Step 4: Track and Maintain
Continue to track historical records and maintain your 12 on 12 analysis.
Example
JKL was a steel manufacturing company that serviced the oil & gas industry. Because they had no trends readily available to use in their projections, our consultants researched the past 30 years of trends in oil prices and put them in the spreadsheet you’ll see in the next Topic.
If you’re not familiar with the oil & gas industry, let’s give a brief rundown…
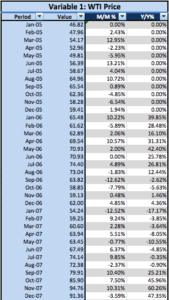
Use West Texas Intermediate (WTI) as a benchmark for oil pricing. Many commonly compare it to Brent crude. We compiled all of the data for WTI over the past 30 years.
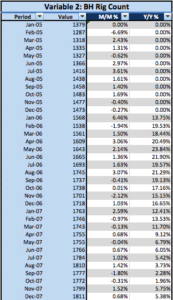 One of the conclusions that we came to after researching trends in WTI is that the price correlated with Baker Hughes rig counts. The lower the WTI, the more rigs that were built. Once you’re able to calculate these indices, you’ll be better prepared to create economic and predictive analyses.
12 On 12 Analysis Template
Download the 12 on 12 Analysis Template. This is a useful guide that we’ll walk you through during the rest of the 12 on 12 Analysis Execution Plan.